
Advanced Reporting
Turn data into decisions. Create powerful, customizable dashboards and reports using any available data fields.
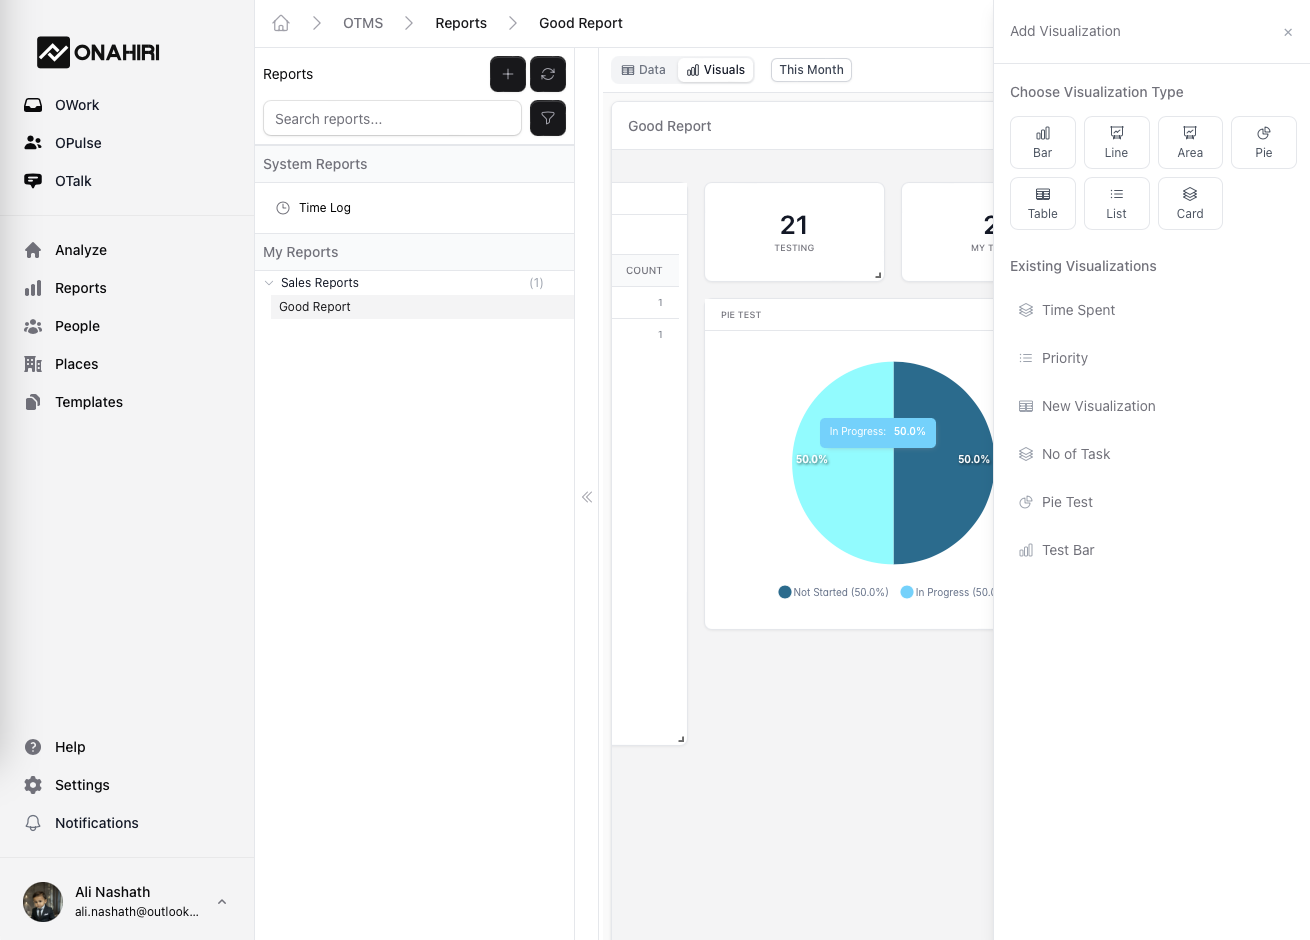
Custom Dashboards
Design your own dashboard views using filters, fields, and chart types. Switch between data and visual mode with one click.
Insightful Analytics
Track task progress, effort, time spent, priorities, and statuses—aggregated by field and filterable by date range.
Drag & Drop Visualization
Add charts and rearrange widgets directly from the UI. Bar, pie, and stat blocks supported for dynamic insights.
Powerful Reporting Features
Reporting Made Simple
Onahiri Reports empowers your teams to track progress, analyze performance, and make data-driven decisions—all in one visual workspace.
DYNAMIC DASHBOARDS
Build personalized dashboards with live metrics tailored to your team's focus areas.
SMART FIELD SELECTION
Pick the data that matters—track anything from task priority to status and completion.
REAL-TIME VISUALS
Get instant chart updates without manual refresh—always work with the latest numbers.
TIME REPORTING
Analyze time spent vs. effort across tasks, roles, or entire projects with full breakdowns.
MODULAR LAYOUT
Drag, resize, and arrange visual blocks to create reports that suit your workflow.
EASY SHARING
Share dashboards instantly with your team